> ## Documentation Index
> Fetch the complete documentation index at: https://ngquct-docs-fix-500-query-results.mintlify.site/llms.txt
> Use this file to discover all available pages before exploring further.
# Query Insights
> Which queries you run most, which cost the most time, and which got slower
A query you ran 400 times with 400 different ids is one row here, not 400. That regrouping is what turns a list of what you ran into a ranking of what is worth looking at. Every number on the page is computed on your Mac from the [query history](/features/query-history) already stored there, and none of it is uploaded.
Needs a [Starter license](/features/licensing).
Open it from **Database > Query Insights**. It opens as a tab, one per connection, and reuses the tab you already have open.
 ## The panels
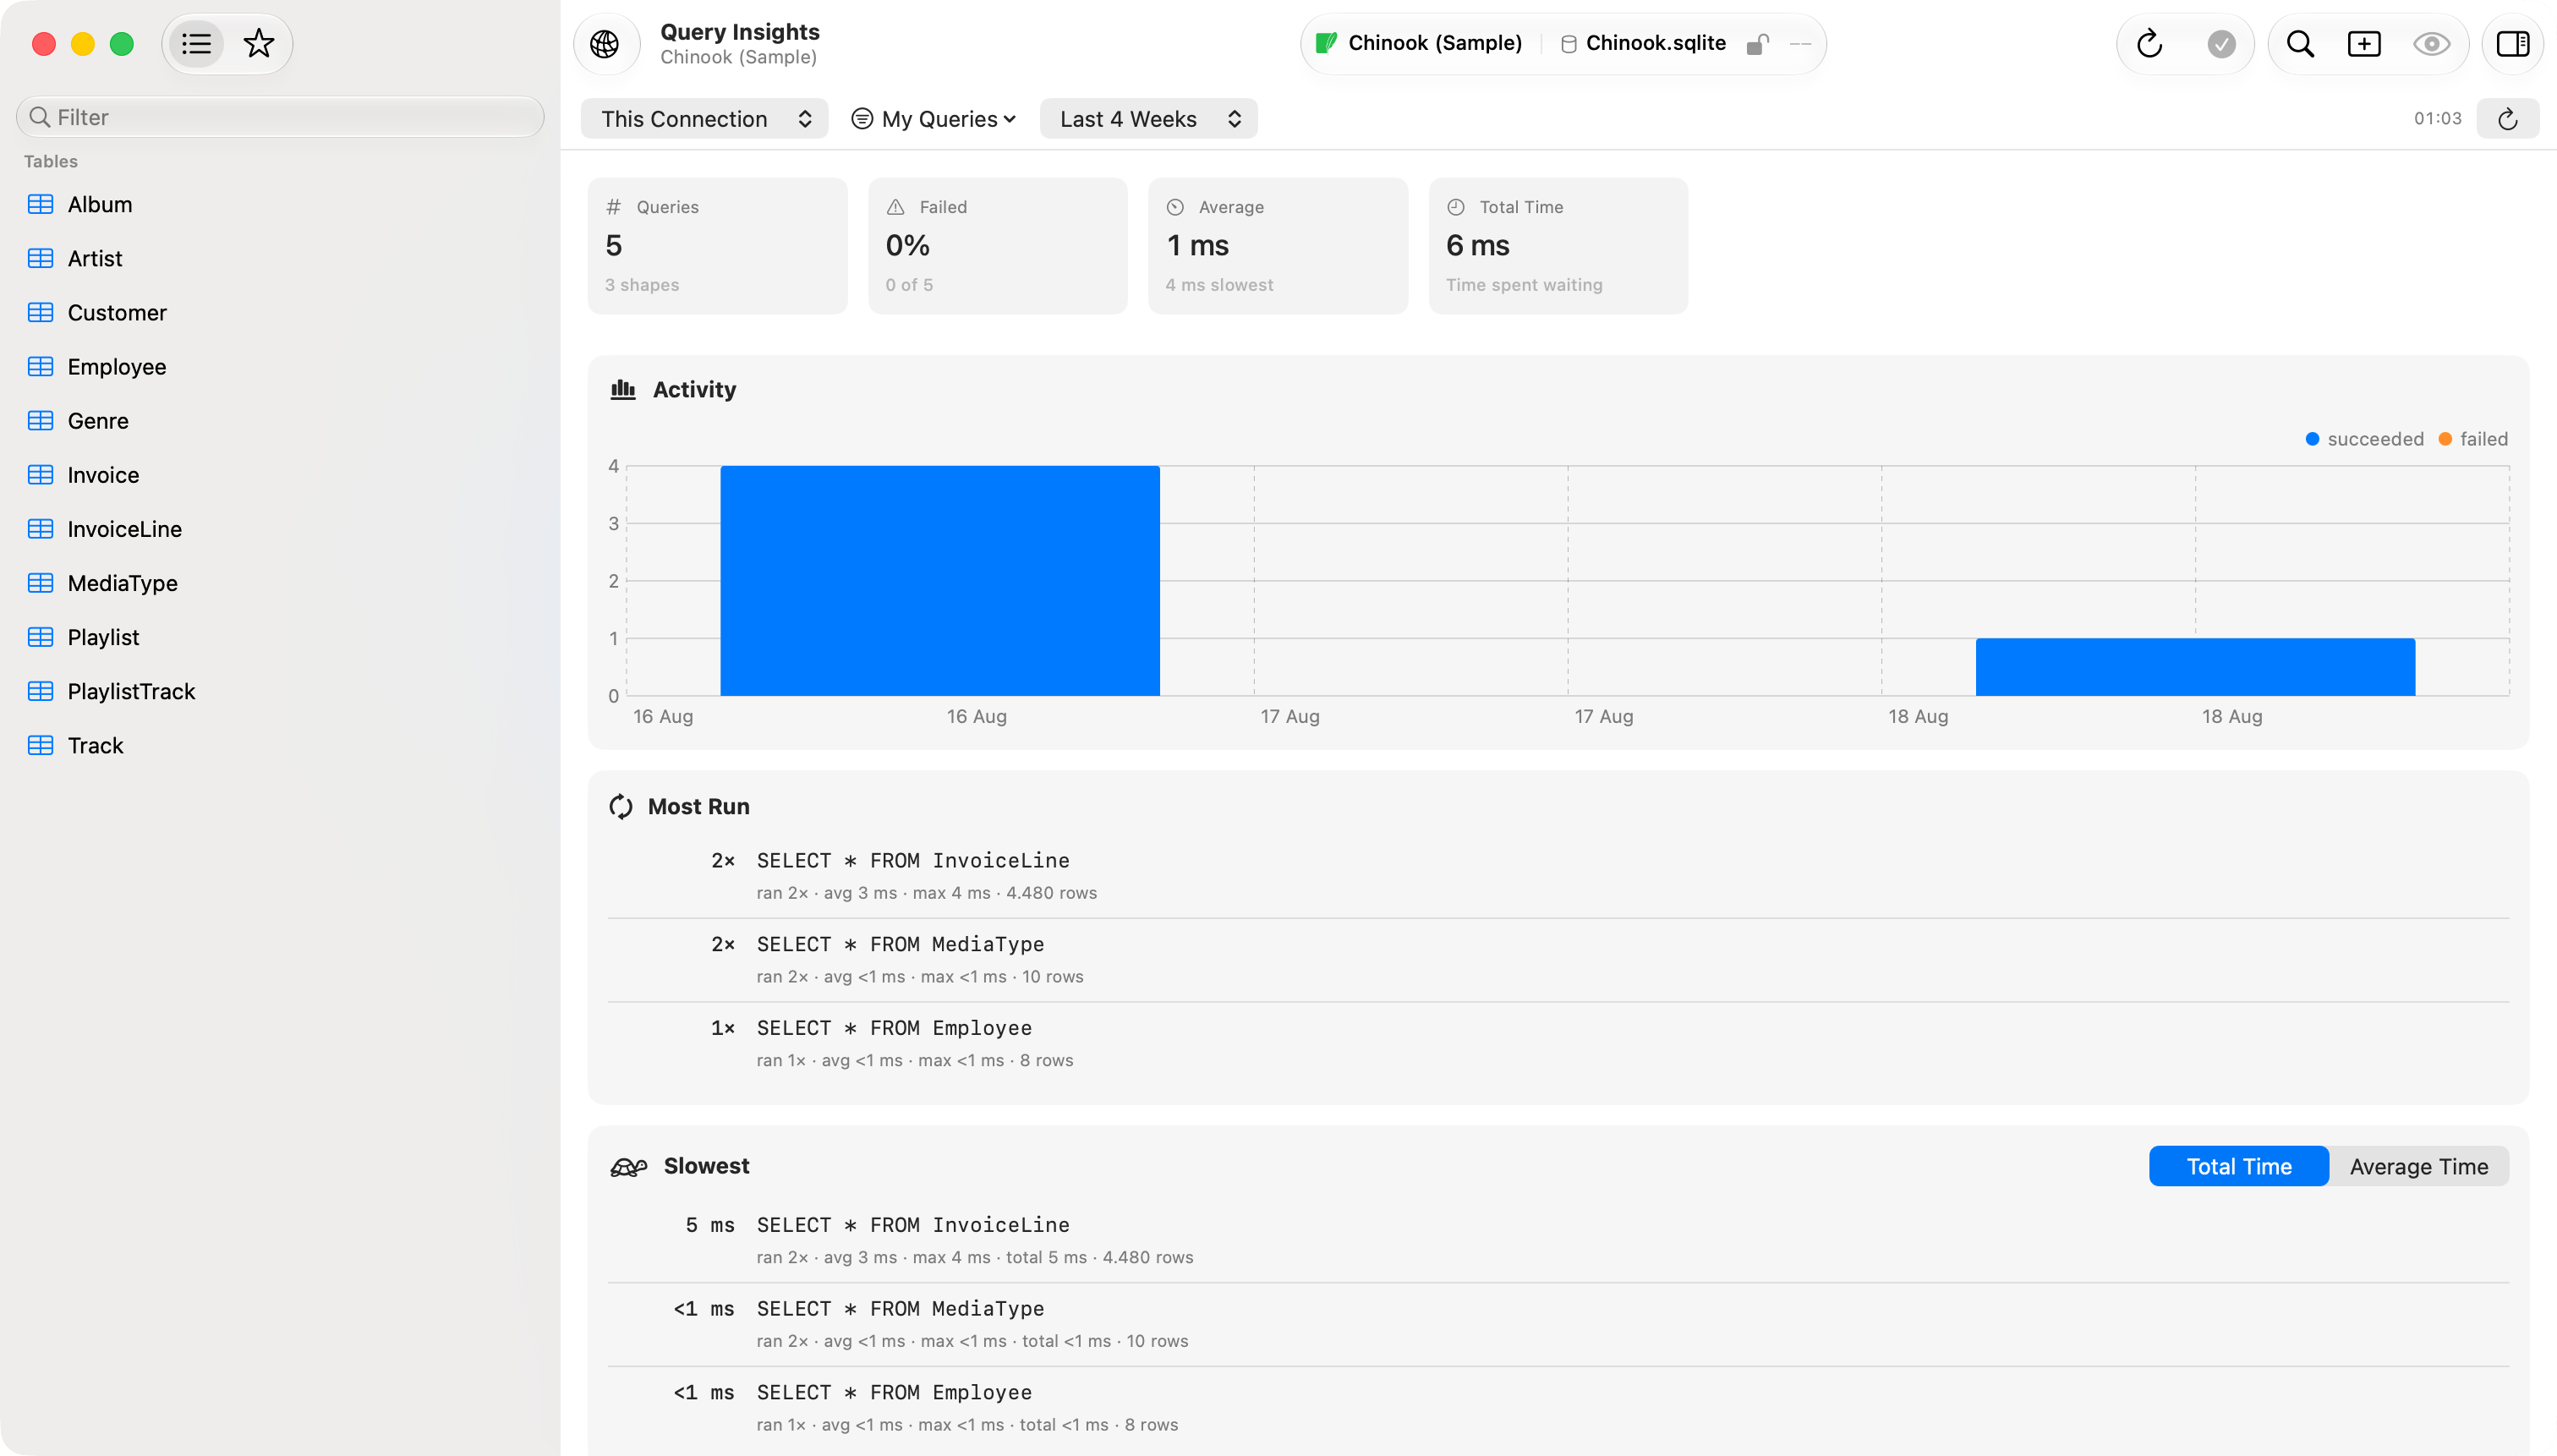
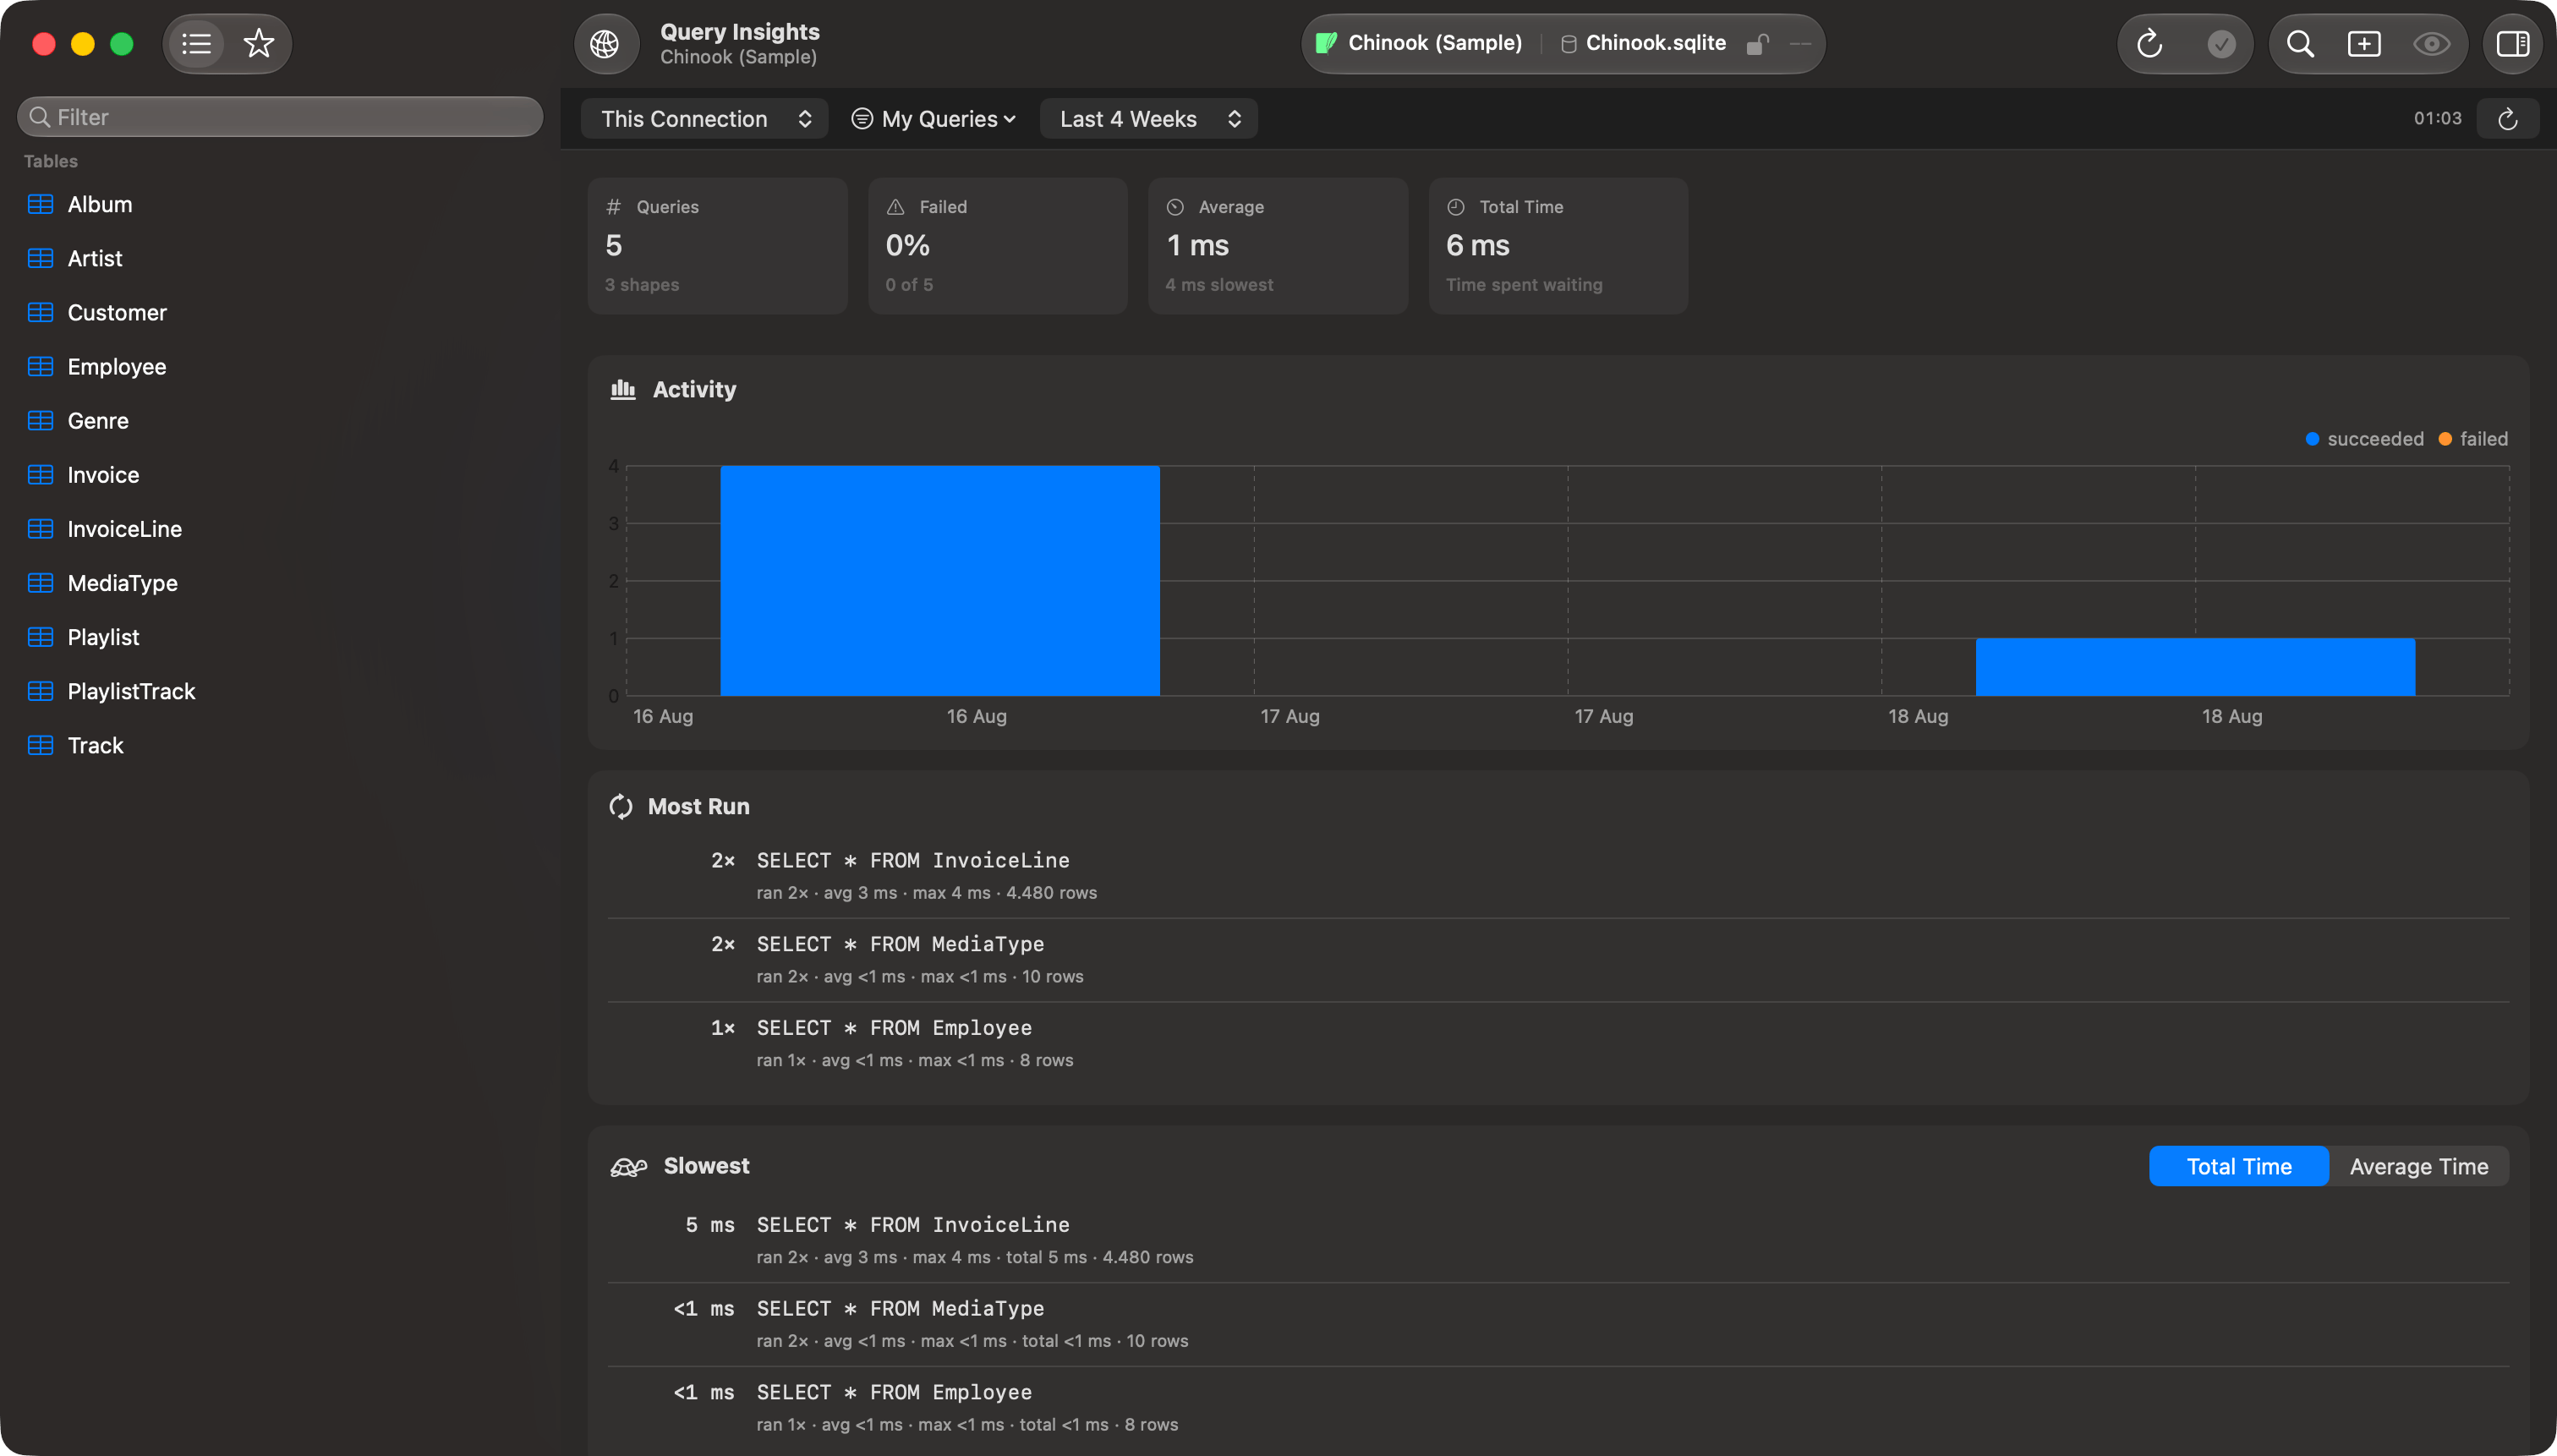
Each ranked panel lists the top 10 shapes. Right-click a row for **Copy Query** and **Load in Editor**: both give you the most recent real query in the group, values and all, from a run the row is actually counting, so the connection, sources and date range you picked all apply. In **Failures** it comes from the run that produced the error beside it.
### Summary
Across the top: how many queries ran, what share failed, the average duration, and the total time spent waiting.
### Activity
Queries per day, split into succeeded and failed. A range of two days or less is charted by hour instead.
### Most Run
Shapes ranked by how many times they ran.
### Slowest
Ranked by **Total Time** by default, which finds the query that actually costs you time: usually a quick one you run constantly rather than a slow one you ran once. Switch **Rank By** to **Average Time** for the query that is slow every time. Average Time lists only shapes that ran at least 3 times.
### Got Slower
Compares the range you picked against the range immediately before it, so **Last 7 Days** compares against the 7 days before that. An unbounded range compares the last 7 days. A shape is reported when all three hold:
* it ran at least 5 times in **both** periods
* its average got at least 50% slower
* its average grew by at least 25 ms
Only successful runs count. Rows are ordered by the time the slowdown actually costs, so a query that got twice as slow and runs all day ranks above one that got ten times slower and runs twice.
### Failures
Shapes ranked by how many times they failed, with the most recent error message for each.
## What to do with a finding
A row in **Slowest** or **Got Slower** is a shape, not a diagnosis. **Load in Editor** puts a real example in a query tab, where `Cmd+Option+E` gives you the execution plan: see [Explain Visualization](/features/explain-visualization).
Durations are measured on this side of the wire, from sending the query to getting the result, so they cover network time and any [SSH tunnel](/connections/ssh-profiles) as well as the server. For server-side timings, locks and running queries, see the [Server Dashboard](/features/server-dashboard).
A shape ranked high under **Table Browsing** came from the app paging or sorting a table, not from anything you wrote.
## How shapes are grouped
Values are stripped out of every statement and what is left is the shape:
| Written | Counted as |
| ------------------------------------------------- | -------------- |
| `WHERE id = 1` and `WHERE id = 2` | `WHERE id = ?` |
| `IN (1, 2)` and `IN (1, 2, 3, 4)` | `IN (…)` |
| `VALUES (1, 'a')` and `VALUES (1, 'a'), (2, 'b')` | `VALUES (…)` |
| `select * from t` and `SELECT * FROM t` | one shape |
| the same query with and without comments | one shape |
This is the same idea as PostgreSQL's `pg_stat_statements` and MySQL's statement digest, so the numbers mean what they mean there.
Two things stay apart: table and column names keep their capitalization, since `Orders` and `orders` are different tables on a case-sensitive server, and a number inside a name stays part of it, so `events_2025` and `events_2026` are counted separately.
## Filtering
| Control | What it does |
| ------- | ----------------------------------------------------- |
| Scope | This connection, or all connections |
| Source | Which parts of the app the queries came from |
| Date | Last hour, today, last 7 days, last 4 weeks, all time |
Source defaults to **My Queries**, the SQL you wrote yourself, and uses the same source list as the [history drawer](/features/query-history#sources). Date defaults to **Last 4 Weeks** rather than All Time, since "got slower than before" needs a before to compare against. There is no outcome filter.
Insights refreshes as you run queries. The refresh button is for when you want it now.
## What it cannot tell you
It knows what your Mac recorded and nothing else. Queries run before you installed the app, run by other people, or run while [capture was paused](/features/query-history#pausing) are not in it, and neither are queries already pruned by your [retention settings](/features/query-history#storage-and-retention). **All Time** never reaches further back than retention allows.
## The panels
Each ranked panel lists the top 10 shapes. Right-click a row for **Copy Query** and **Load in Editor**: both give you the most recent real query in the group, values and all, from a run the row is actually counting, so the connection, sources and date range you picked all apply. In **Failures** it comes from the run that produced the error beside it.
### Summary
Across the top: how many queries ran, what share failed, the average duration, and the total time spent waiting.
### Activity
Queries per day, split into succeeded and failed. A range of two days or less is charted by hour instead.
### Most Run
Shapes ranked by how many times they ran.
### Slowest
Ranked by **Total Time** by default, which finds the query that actually costs you time: usually a quick one you run constantly rather than a slow one you ran once. Switch **Rank By** to **Average Time** for the query that is slow every time. Average Time lists only shapes that ran at least 3 times.
### Got Slower
Compares the range you picked against the range immediately before it, so **Last 7 Days** compares against the 7 days before that. An unbounded range compares the last 7 days. A shape is reported when all three hold:
* it ran at least 5 times in **both** periods
* its average got at least 50% slower
* its average grew by at least 25 ms
Only successful runs count. Rows are ordered by the time the slowdown actually costs, so a query that got twice as slow and runs all day ranks above one that got ten times slower and runs twice.
### Failures
Shapes ranked by how many times they failed, with the most recent error message for each.
## What to do with a finding
A row in **Slowest** or **Got Slower** is a shape, not a diagnosis. **Load in Editor** puts a real example in a query tab, where `Cmd+Option+E` gives you the execution plan: see [Explain Visualization](/features/explain-visualization).
Durations are measured on this side of the wire, from sending the query to getting the result, so they cover network time and any [SSH tunnel](/connections/ssh-profiles) as well as the server. For server-side timings, locks and running queries, see the [Server Dashboard](/features/server-dashboard).
A shape ranked high under **Table Browsing** came from the app paging or sorting a table, not from anything you wrote.
## How shapes are grouped
Values are stripped out of every statement and what is left is the shape:
| Written | Counted as |
| ------------------------------------------------- | -------------- |
| `WHERE id = 1` and `WHERE id = 2` | `WHERE id = ?` |
| `IN (1, 2)` and `IN (1, 2, 3, 4)` | `IN (…)` |
| `VALUES (1, 'a')` and `VALUES (1, 'a'), (2, 'b')` | `VALUES (…)` |
| `select * from t` and `SELECT * FROM t` | one shape |
| the same query with and without comments | one shape |
This is the same idea as PostgreSQL's `pg_stat_statements` and MySQL's statement digest, so the numbers mean what they mean there.
Two things stay apart: table and column names keep their capitalization, since `Orders` and `orders` are different tables on a case-sensitive server, and a number inside a name stays part of it, so `events_2025` and `events_2026` are counted separately.
## Filtering
| Control | What it does |
| ------- | ----------------------------------------------------- |
| Scope | This connection, or all connections |
| Source | Which parts of the app the queries came from |
| Date | Last hour, today, last 7 days, last 4 weeks, all time |
Source defaults to **My Queries**, the SQL you wrote yourself, and uses the same source list as the [history drawer](/features/query-history#sources). Date defaults to **Last 4 Weeks** rather than All Time, since "got slower than before" needs a before to compare against. There is no outcome filter.
Insights refreshes as you run queries. The refresh button is for when you want it now.
## What it cannot tell you
It knows what your Mac recorded and nothing else. Queries run before you installed the app, run by other people, or run while [capture was paused](/features/query-history#pausing) are not in it, and neither are queries already pruned by your [retention settings](/features/query-history#storage-and-retention). **All Time** never reaches further back than retention allows.